 in Healthcare](https://file-host.link/website/vectorcare-o874qh/assets/blog-images/649e86ac-c73f-48b1-8a2d-0a1e4d3d8677/1782995070579095_c62819972c4641f5aa0116ccc6d6219d/360.webp)
Introduction
When discharge logistics stall, the consequences ripple upstream fast. A patient waiting for transport occupies a bed that an ED patient needs. That ED patient boards for hours — and according to ACEP, boarding costs hospitals nearly double the daily cost of inpatient care: $1,856 per day for boarding patients versus $993 for patients in inpatient care.
The financial pressure extends to the back end as well. Patients discharged without coordinated follow-up — transport, DME, post-acute placement — are far more likely to return. AHRQ data shows 30-day readmissions cost an average of $16,300, or 12.4% more than the index admission. Both problems trace back to the same root: patient flow treated as a departmental scheduling task rather than a system-wide coordination challenge.
Patient flow isn't an ED scheduling issue. It spans the entire care continuum — from admission through discharge, transport, DME delivery, and post-acute placement. Fixing it means coordinating every handoff across that continuum, not optimizing one department at a time.
This guide covers 7 actionable strategies to optimize patient flow, the KPIs that actually matter, and how healthcare teams can move from reactive firefighting to coordinated, infrastructure-level flow management.
Key Takeaways
- Poor patient flow doubles ED boarding costs and drives avoidable readmission expenses
- Discharge planning must begin at admission, not the day a patient leaves
- Transport and post-acute logistics are the hidden bottleneck most hospitals aren't measuring
- Predictive analytics and automation convert reactive operations into proactive ones
- Governance structures, not dashboards alone, are what sustain process and technology improvements long-term
What Is Patient Flow Optimization in Healthcare?
Patient flow is the movement of patients through every stage of the healthcare system — intake, admission, diagnosis, treatment, discharge, and post-acute handoffs. Optimization means reducing delays, variability, and waste at each transition point.
Why It Matters Operationally and Financially
Efficient flow connects directly to outcomes that hospital leaders track daily:
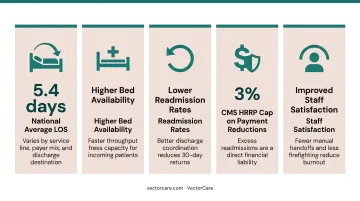
- Reduced length of stay — the national average is 5.4 days (AHRQ HCUP), but LOS varies significantly by service line, payer mix, and discharge destination
- Higher bed availability — faster throughput frees capacity for incoming patients
- Lower readmission rates — better discharge coordination reduces 30-day returns
- Stronger revenue cycle performance — CMS caps HRRP payment reductions at 3% for excess readmissions, making avoidable returns a direct financial liability
- Improved staff satisfaction — fewer manual handoffs and less firefighting reduce burnout
Patient Flow as a Logistics Infrastructure Problem
VectorCare's founding insight — the one that shaped its platform architecture — is that patient flow is an infrastructure problem. Delays in transport, post-discharge logistics, and inter-facility coordination aren't isolated failures. They're structural bottlenecks built into how care systems are (or aren't) connected. Addressing them requires changes to the underlying infrastructure, not patches to existing workflows.
What Causes Poor Patient Flow in Healthcare Facilities?
Three root causes account for most patient flow breakdowns.
Capacity Constraints and Delayed Discharges
When discharge processes lag — pending authorizations, missing transport, incomplete DME orders — beds stay occupied longer than necessary. That creates upstream congestion through the ED, ICU, and PACU. The PROPEL Discharge study found that only 26.2% of adult medicine patients left within 90 minutes of a discharge order before intervention. The bottleneck wasn't the clinical decision — it was everything that had to happen after it.
Fragmented Communication and Departmental Silos
ED, nursing units, case management, and transport teams that operate without a shared real-time view of patient status generate repeated phone calls, missed escalations, and handoff failures. Each department optimizes for its own metrics. No one owns the end-to-end journey.
Manual Logistics Coordination
In facilities still running manual workflows, a coordinator spending 31 minutes per logistics call isn't an outlier — it's the norm. Phone-based coordination for transport, DME delivery, and home health creates delays that accumulate invisibly across every shift. The time lost rarely shows up on a dashboard, but it compounds directly into longer length of stay.
Each of these breakdowns is addressable. The strategies below target all three.
7 Strategies to Optimize Patient Flow in Healthcare
Strategy 1: Conduct a Baseline Operational Assessment
No improvement plan survives contact with a problem it hasn't accurately diagnosed. Before making changes, map current-state patient pathways with enough precision to identify where delays actually cluster — not where people assume they do.
Practical assessment methods:
- Process mapping with multidisciplinary teams across ED, inpatient units, case management, and transport
- Gemba walks — direct observation during both peak and off-peak hours to capture what happens in practice, not what's documented in policy
- EMR and ADT data extraction to identify patterns in LOS variance, bed turnover rates, and discharge timing distribution
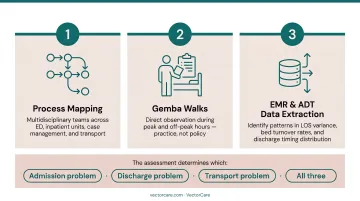
The goal is to distinguish root causes from symptoms. An ED with long boarding times might have an admission problem, a discharge problem, a transport problem, or all three. The assessment determines which.
Strategy 2: Standardize Admission, Discharge, and Transfer Protocols
Inconsistent ADT processes create unpredictable variability. When the criteria for admission, transfer, and discharge differ by unit, shift, or attending physician, care teams can't plan resources proactively — they react.
Key standardization tactics:
- Set expected discharge dates at or near admission and update them daily with documented barriers
- Establish uniform transfer acceptance criteria across units to prevent inconsistent bed request decisions
- Distribute elective admissions evenly across the week — a 2024 New York data analysis found that hospital capacity fluctuations were driven significantly by variability in elective admission and discharge activity
One important caveat: the Journal of Hospital Medicine warned in 2024 against using discharge-before-noon as a blanket flow target. Arbitrary time quotas shift work into morning bottlenecks without reducing total LOS. The better approach is barrier-specific discharge readiness workflows that identify and resolve blockages before they cause day-of delays.
Strategy 3: Improve Discharge Planning and Post-Discharge Logistics Execution
Discharge planning that starts on the day of discharge is already too late. Early identification of potential barriers — insurance authorization delays, transportation needs, DME orders, home health setup — gives care teams time to resolve them before they stall departure.
What early discharge planning looks like in practice:
- Case management involvement at or near admission
- Barrier tracking updated daily in the patient record
- Escalation protocols when barriers aren't resolved within defined timeframes
The Post-Discharge Execution Gap
Making a plan isn't the same as executing it. Coordinating NEMT, arranging home health, and confirming DME delivery often still happens via phone calls and manual follow-up — even in facilities with solid discharge planning processes. This gap causes day-of delays, failed discharges, and avoidable readmissions.
VectorCare addresses this directly. Its platform connects discharge decisions to transport and post-acute service coordination within a single workflow — pulling patient data from EHR systems like Epic via SMART on FHIR and dispatching transport automatically.
DME and home health status track across its 2,500+ facility network in real time. The result is faster, more reliable discharge execution without coordinators toggling between disconnected systems.
Strategy 4: Leverage Predictive Analytics and Real-Time Data
The difference between reactive and proactive hospital operations often comes down to when decisions get made. Predictive analytics shifts that timing — from responding to bottlenecks to preventing them.
Practical applications:
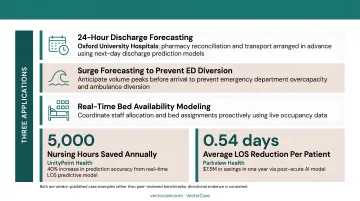
- 24-hour discharge forecasting — Oxford University Hospitals researchers used three years of patient records to build models predicting next-day discharges, enabling pharmacy reconciliation and transport arrangements to be completed in advance
- Surge forecasting to prevent ED diversion by anticipating volume peaks before they arrive
- Real-time bed availability modeling to coordinate staff allocation and bed assignments proactively
UnityPoint Health reported 5,000 nursing hours saved annually and a 40% increase in prediction accuracy from a real-time LOS predictive model. Parkview Health's post-acute AI model reduced average LOS by 0.54 days per patient, generating $7.5M in savings in one year. Both are vendor-published case examples rather than peer-reviewed benchmarks, but the directional evidence is consistent: predictive tools that trigger work queues earlier deliver measurable throughput gains.
Strategy 5: Streamline Patient Transport and Inter-Facility Transfer Coordination
Every hour a patient waits in a hospital bed for inter-facility transport is an hour another patient waits in the ED. Transfer delays don't stay isolated — they compound system-wide. Research on critically ill surgical sepsis patients found delayed inter-hospital transfer was independently associated with a 10-day increase in hospital LOS, underscoring the downstream cost of slow coordination.
The Manual Coordination Problem
Phone tag between facilities, unclear transport availability, and disconnected communication between clinical decision-makers and dispatchers create multi-hour delays that are largely preventable.
In facilities without purpose-built logistics infrastructure, a coordinator calling five transport vendors sequentially — waiting on hold, manually re-entering patient data into each system — is the standard process, not the exception.
Automating Transfer Coordination
Purpose-built patient logistics platforms replace that manual process. VectorCare's A.D.I. (Automated Dispatching Intelligence) automates dispatch, enables real-time transport tracking, and routes EHR data directly into the coordination workflow — eliminating the phone calls, manual data entry, and status-check interruptions that slow transfers. The platform processes transport requests across its network at a rate of 3.23 requests per minute.
Strategy 6: Automate Manual Coordination Workflows Across the Care Continuum
Repetitive manual tasks consume clinical and administrative staff time at scale. Calling transport vendors, confirming authorization status, scheduling follow-up appointments, managing DME orders — each task might take 5–30 minutes individually, but across a facility's daily volume, the aggregate burden is enormous.
What workflow automation replaces:
- Sequential vendor calls → automated broadcast to credentialed provider networks
- Manual data re-entry → SMART on FHIR integrations that auto-extract patient data from Epic
- Status-check phone calls → real-time tracking visible within the EHR interface
- Manual documentation → automatic transaction recording in the patient record
VectorCare's transport scheduling platform has demonstrated that scheduling takes less than 3 minutes, vs ~31 minutes by phone (90% reduction), in documented implementations. In 2025, A.D.I. saved more than 100,000 hours for healthcare systems and suppliers — time that clinical and administrative staff redirected to patient care.
The broader principle: automation doesn't replace care coordinators. It gives them back the time to actually coordinate care.
Strategy 7: Build Cross-Departmental Governance and Communication Structures
Patient flow fails when departments optimize for their own metrics instead of sharing accountability for the end-to-end patient journey. The ED wants shorter boarding times. Inpatient units want manageable census. Case management wants completed discharge plans. Transport wants confirmed pickup addresses. Without governance structures that align these incentives, each team solves its own piece — and the handoffs between them break.
Key governance mechanisms:
- Centralized transfer or command centers with real-time operational dashboards that surface census, boarding hours, pending discharges, and transport status in one view
- Daily interdisciplinary flow huddles at set times — not ad hoc — where boarding, discharge barriers, and anticipated admissions are reviewed by representatives from each department
- Defined escalation protocols when bottlenecks exceed thresholds (e.g., boarding time exceeds four hours, discharge order-to-departure exceeds 90 minutes)
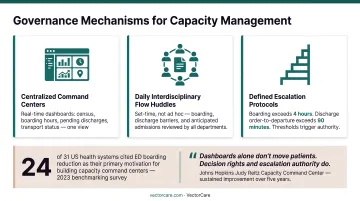
A 2023 benchmarking survey of 31 US health systems found that reducing ED boarding was the most common motivation for building capacity command centers, cited by 24 respondents. The Johns Hopkins Judy Reitz Capacity Command Center demonstrated sustained improvement over five years by combining real-time visibility with operational authority.
The lesson from less successful implementations: dashboards alone don't move patients. Decision rights and escalation authority do.
How to Measure Patient Flow Optimization Success
Measuring patient flow requires tracking two distinct categories: outcome indicators that confirm whether the system improved, and process indicators that reveal where and why it improved or stalled.
Outcome KPIs
| KPI | What It Measures |
|---|---|
| Length of stay (LOS) and LOS variance | Overall throughput efficiency by service line |
| ED boarding hours | Systemic capacity pressure and inpatient flow |
| 30-day readmission rate | Discharge quality and post-acute coordination |
| Discharge time-of-day distribution | Whether beds free up when downstream patients need them |
Process KPIs
| KPI | What It Measures |
|---|---|
| Admission-to-bed assignment time | Intake bottlenecks and bed management efficiency |
| Transport request-to-dispatch time | Logistics execution speed |
| Discharge order-to-patient departure time | Post-order execution gaps (PROPEL benchmark: 90 minutes) |
| Handoff completion accuracy rates | Communication reliability across transitions |
Process KPIs belong in operational huddles and leadership scorecards — reviewed regularly, not just after a crisis. Outcome KPIs confirm whether your optimization strategies are working; process KPIs show exactly where to intervene next.
Frequently Asked Questions
What does optimizing patient flow mean?
Patient flow optimization means systematically reducing delays, variability, and waste as patients move through the healthcare system — from intake through discharge and post-acute coordination. The goal is better care quality, shorter length of stay, and stronger resource utilization.
What are the KPIs for optimizing patient flow?
The most important KPIs include length of stay, ED boarding hours, bed turnover rates, discharge time of day, 30-day readmission rates, and transport request-to-dispatch time. Tracking both outcome measures (did LOS improve?) and process measures (why did it improve?) is necessary for sustained, evidence-based improvement.
What are the 5 P's of patient experience?
The 5 P's used in nursing rounds are Pain, Potty (personal needs), Positioning, Possessions, and Pump (or Periphery, depending on the organization). They provide a structured framework for proactive patient check-ins that reduce call light use and improve satisfaction — the fifth P varies by facility.
What are the 4 C's of patient care?
Starfield's framework identifies the four core functions of primary care as First-contact access, Continuity, Comprehensiveness, and Coordination. These principles define care coordination quality and directly inform how effective patient flow systems are designed.
What is the difference between patient flow and patient throughput?
Patient flow describes how patients move through the care delivery process as a whole. Throughput is the operational measure of how efficiently that movement happens, based on time and volume metrics — making it easier to measure directly and the more practical lever for performance improvement.